

Designed with larger sites in mind such as those in the manufacturing or industrial sectors.
Also suited to any site with multiple metering points to monitor, the Atlas Energy Monitoring System puts the data you need to reduce energy use, carbon emissions, & costs at your fingertips.
Key Benefits Include:
- Monitor the use of electricity, gas, water, or any other resource that can be metered.
- Improve energy efficiency, reduce environmental impact, cut carbon emissions, and lower costs.
- Highlight wasteful practices, inefficient equipment, areas of high or unexpected/unnecessary consumption.
- Immediately see the measurable improvements from implemented energy saving measures.
- Help meet your ESOS, ISO50001, and SECR obligations.
- View & analyse Real-time and historic energy use data.
- Analyse the energy use patterns of individual production lines, machinery, departments, & whole sites.
- Apply tariff costs to check bills & allocate accurate energy costs to production.
- Automated production of Excel/PDF reports in consumption units or £p.
- Flexible live dashboards allow customisable display of charts, tables, & gauges.
- Set targets with exception alerts by Windows Notification & email swiftly warning of over or under use.
Key Benefits include:
- Monitor the use of electricity, gas, water, or any other resource that can be metered.
- Improve energy efficiency, reduce environmental impact, cut carbon emissions, and lower costs.
- Highlight wasteful practices, inefficient equipment, areas of high or unexpected/unnecessary consumption.
- Immediately see the measurable improvements from implemented energy saving measures.
- Help meet your ESOS, ISO50001, and SECR obligations.
- View & analyse Real-time and historic energy use data.
- Analyse the energy use patterns of individual production lines, machinery, departments, & whole sites.
- Apply tariff costs to check bills & allocate accurate energy costs to production.
- Automated production of Excel/PDF reports in consumption units or £p.
- Flexible live dashboards allow customisable display of charts, tables, & gauges.
- Set targets with exception alerts by Windows Notification & email swiftly warning of over or under use.
Log 1/2 Hourly Energy Use Data
The basis of any Energy Monitoring System is the collection of energy usage data.
The Atlas Energy Monitoring System can utilise multiple ATLAS Loggers, GLAS Energy technology GET-**** loggers, & network-connected data saving electricity meters (e.g. ND Cube IP, Accuenergy Acuvim II) to collect energy consumption data (electricity, gas, water etc) in the form of consumption pulse signals, meter register readings gathered via Modbus, or directly within data-saving meters.
The collected data is stored in the logger or meter’s memory in 30 minute periods (to match UK supplier billing periods) and made available for direct collection by the Atlas system software in the case of ATLAS loggers), or uploaded to an FTP server by GLAS GET loggers and data-saving meters.

Log 1/2 Hourly Energy Use Data
The basis of any Energy Monitoring System is the collection of energy usage data.
The Atlas Energy Monitoring System can utilise multiple ATLAS Loggers, GLAS Energy technology GET-**** loggers, & network-connected data saving electricity meters (e.g. ND Cube IP, Accuenergy Acuvim II) to collect energy consumption data (electricity, gas, water etc) in the form of consumption pulse signals, meter register readings gathered via Modbus, or directly within data-saving meters.
The collected data is stored in the logger or meter’s memory in 30 minute periods (to match UK supplier billing periods) and made available for direct collection by the Atlas system software in the case of ATLAS loggers), or uploaded to an FTP server by GLAS GET loggers and data-saving meters.

Collect & Store Data
The AtlasComms software communicates periodically with each of the Atlas loggers in the system, collecting historic and live period data as required. It also monitors folders for uploaded data files provided by GLAS loggers or data-saving meters.
Where hardware allows, live present load (e.g. kW/kVA) data can be gathered on a more frequent basis via Modbus TCP connections.
Data is stored in either a Microsoft SQL Server or a file-based SQLite database and is permanently available for analysis within the front-end AtlasEMS software.
Third-party data management and analysis applications such as Seeq and PI can also be granted access to the AtlasEMS database for integration of the data into those packages.
Collect & Store Data
The AtlasComms software communicates periodically with each of the Atlas loggers in the system, collecting historic and live period data as required. It also monitors folders for uploaded data files provided by GLAS loggers or data-saving meters.
Where hardware allows, live present load (e.g. kW/kVA) data can be gathered on a more frequent basis via Modbus TCP connections.
Data is stored in either a Microsoft SQL Server or a file-based SQLite database and is permanently available for analysis within the front-end AtlasEMS software.
Third-party data management and analysis applications such as Seeq and PI can also be granted access to the AtlasEMS database for integration of the data into those packages.
Analyse & Report
The main function of the Atlas Energy Monitoring system. View in-depth, period by period charts for any metered circuit connected to the system loggers.
Analyse daily, weekly, monthly (or any other time period) totals. Produce reports directly into Excel or PDF format. All to help you identify & improve energy efficiency, reduce carbon emissions, and lower energy costs.
Working in conjunction with but independently of AtlasComms, further AtlasEMS software modules enhance the energy monitoring system’s analysis capabilities.
A comprehensive set of consumption, demand, & tariff analysis reports are provided allowing reporting in £p to facilitate bill validation and accurate cost allocation to individual departments or production lines. All rtouine reporting can be automatied with reports produced in CSV, XLSX, or PDF format on a daily, weekly, or monthly schedule.
Period by period, daily, weekly, & monthly targets can be set with alerts sent via Windows Notification & email swiftly warning of over or under use. Target breaches are also highlighted in reports.
Customisable dashboard displays show historic trends and live period data via chart, tables, & gauges.

Analyse & Report
The main function of the Atlas Energy Monitoring system. View in-depth, period by period charts for any metered circuit connected to the system loggers.
Analyse daily, weekly, monthly (or any other time period) totals. Produce reports directly into Excel or PDF format. All to help you identify & improve energy efficiency, reduce carbon emissions, and lower energy costs.
Working in conjunction with but independently of AtlasComms, further AtlasEMS software modules enhance the energy monitoring system’s analysis capabilities.
A comprehensive set of consumption, demand, & tariff analysis reports are provided allowing reporting in £p to facilitate bill validation and accurate cost allocation to individual departments or production lines. All rtouine reporting can be automatied with reports produced in CSV, XLSX, or PDF format on a daily, weekly, or monthly schedule.
Period by period, daily, weekly, & monthly targets can be set with alerts sent via Windows Notification & email swiftly warning of over or under use. Target breaches are also highlighted in reports.
Customisable dashboard displays show historic trends and live period data via chart, tables, & gauges.
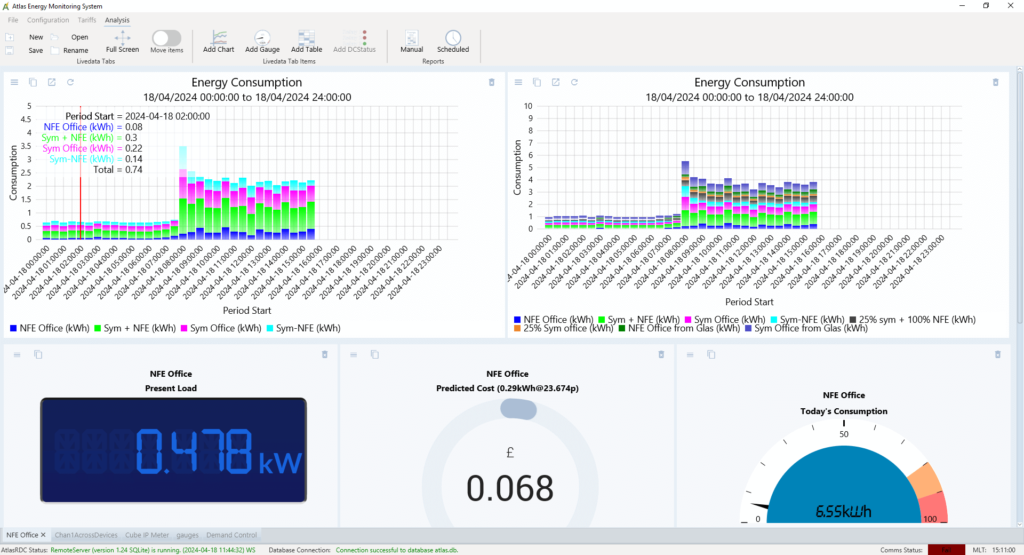
Monitor Live Energy Usage
Depending upon the type of logger or data-saving meter in use and its configuration, the AtlasEMS software can also provide live display modules and user configurable dashboards to allow live monitoring of present period data including:
- Consumption so far (e.g. kWh in the current 1/2 hour period)
- Present Load (e.g. kW or kVA)
- Predicted Period Demand (e.g. predicted period kW)
Monitor Live Energy Usage
Depending upon the type of logger or data-saving meter in use and its configuration, the AtlasEMS software can also provide live display modules and user configurable dashboards to allow live monitoring of present period data including:
- Consumption so far (e.g. kWh in the current 1/2 hour period)
- Present Load (e.g. kW or kVA)
- Predicted Period Demand (e.g. predicted period kW)